本文实例为大家分享了OpenCV实现图片亮度增强或减弱的具体代码,供大家参考,具体内容如下
对每个像素点的三通道值进行同步放大,同时保持通道值在0-255之间
将图像中的像素限制在最小值和最大值之间,超过此区间的值赋值为最小值或最大值
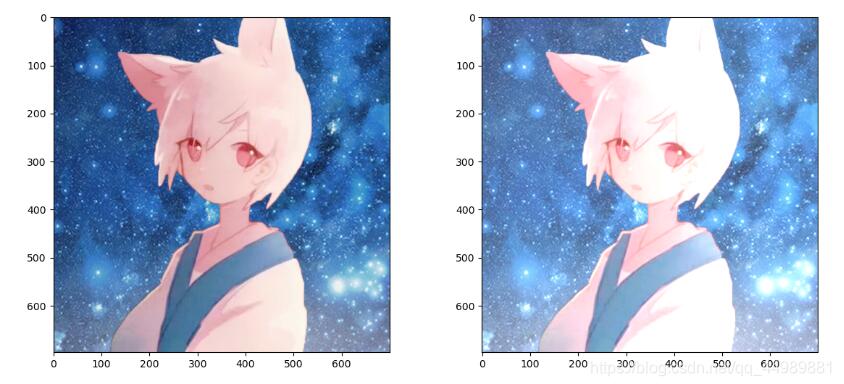
图片亮度增强
|
1
2
3
4
5
6
7
8
9
10
11
12
13
14
15
16
17
18
19
20
21
22
23
24
25
26
27
28
29
30
|
import cv2import numpy as npimport matplotlib.pyplot as pltimg = cv2.imread('1.png', 1)height, width = img.shape[:2]dst = np.zeros((height, width, 3), np.uint8)for i in range(0, height): for j in range(0, width): (b, g, r) = img[i, j] bb = int(b) + 50 gg = int(g) + 50 rr = int(r) + 50 if bb > 255: bb = 255 if gg > 255: gg = 255 if rr > 255: rr = 255 dst[i, j] = (bb, gg, rr)img = cv2.cvtColor(img, cv2.COLOR_BGR2RGB)dst = cv2.cvtColor(dst, cv2.COLOR_BGR2RGB)plt.figure(figsize=(14, 6), dpi=100) # 设置绘图区域的大小和像素plt.subplot(121)plt.imshow(img)plt.subplot(122)plt.imshow(dst)plt.show() |
运行结果:

|
1
2
3
4
5
6
7
8
9
10
11
12
13
14
15
16
17
18
19
20
21
22
23
24
25
26
27
|
import cv2import numpy as npimport matplotlib.pyplot as pltimg = cv2.imread('1.png', 1)height, width = img.shape[:2]dst = np.zeros((height, width, 3), np.uint8)for i in range(0, height): for j in range(0, width): (b, g, r) = img[i, j] bb = int(b * 1.3) + 10 gg = int(g * 1.2) + 15 if bb > 255: bb = 255 if gg > 255: gg = 255 dst[i, j] = (bb, gg, r)img = cv2.cvtColor(img, cv2.COLOR_BGR2RGB)dst = cv2.cvtColor(dst, cv2.COLOR_BGR2RGB)plt.figure(figsize=(14, 6), dpi=100) # 设置绘图区域的大小和像素plt.subplot(121)plt.imshow(img)plt.subplot(122)plt.imshow(dst)plt.show() |
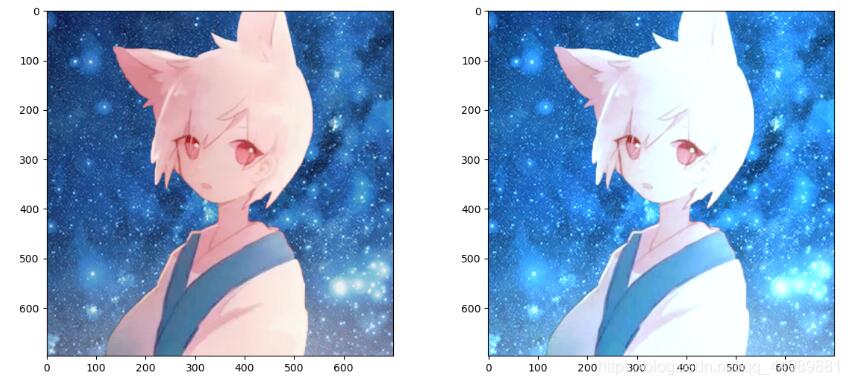
运行结果:

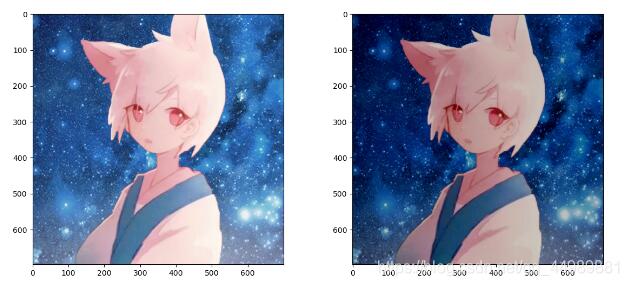
图片亮度减弱
|
1
2
3
4
5
6
7
8
9
10
11
12
13
14
15
16
17
18
19
20
21
22
23
24
25
26
27
28
29
30
|
import cv2import numpy as npimport matplotlib.pyplot as pltimg = cv2.imread('1.png', 1)height, width = img.shape[:2]dst = np.zeros((height, width, 3), np.uint8)for i in range(0, height): for j in range(0, width): (b, g, r) = img[i, j] bb = int(b) - 50 gg = int(g) - 50 rr = int(r) - 50 if bb < 0: bb = 0 if gg < 0: gg = 0 if rr < 0: rr = 0 dst[i, j] = (bb, gg, rr)img = cv2.cvtColor(img, cv2.COLOR_BGR2RGB)dst = cv2.cvtColor(dst, cv2.COLOR_BGR2RGB)plt.figure(figsize=(14, 6), dpi=100) # 设置绘图区域的大小和像素plt.subplot(121)plt.imshow(img)plt.subplot(122)plt.imshow(dst)plt.show() |
运行结果:

以上就是本文的全部内容,希望对大家的学习有所帮助,也希望大家多多支持服务器之家。
原文链接:https://blog.csdn.net/qq_44989881/article/details/117163026


